Webinar highlights: Carbon in a waste world
24th March 2023
We caught up with Bethany Ciftci, Internal Communications Executive at SUEZ recycling and recovery UK, to find out her key takeaways from our recent webinar: Carbon in a waste world.
We are very used to policy and metrics based on weight, however the need to measure the waste and resource sector’s services and outcomes in carbon is upon us, underpinned by the journey to net zero. SUEZ recycling and recovery UK’s recent webinar, chaired by Stuart Hayward-Higham, Chief Technical Development and Innovation Officer, explored the drivers, linkages and measurements that are needed to profile the carbon burdens and benefits of our sector.
What does it mean?
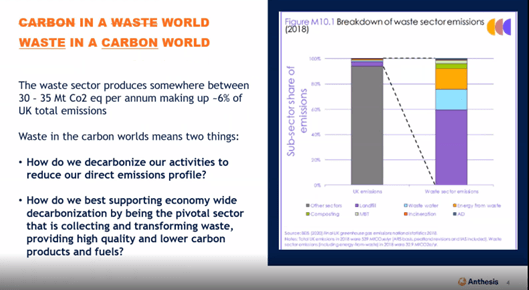
The first panellist, Jamie Warmington from Anthesis, a sustainability consultancy, gave an overview of what ‘carbon in a waste world’ means. Unsurprisingly, it isn’t that straight forward, as there are a lot of nuances around how carbon in the waste sector should, could or perhaps will work in the future. Jamie went on to mention that we can’t look at this topic without considering the role that waste plays in the wider carbon agenda – which led him to rephrase the title of ‘carbon in a waste world’ to ‘waste in a carbon world’.
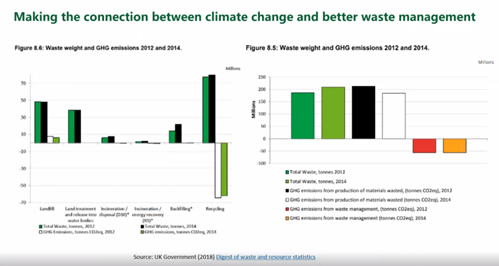
Jamie mentioned that the waste sector accounts for 6-8% of the UK’s emissions profile, and so we need to contribute to the overall UK ambition around net zero. He shared a graph (see below) breaking this down further – and we can see that the areas producing the most emissions in our sector are landfill, wastewater, and energy-from-waste.
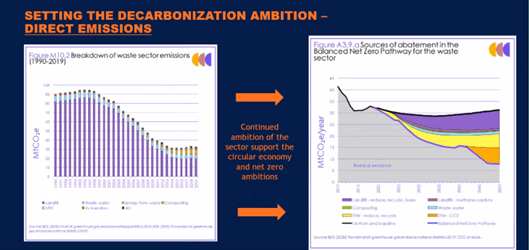
Jamie then went on to look at how our sector’s emissions profile has changed since 1990. He revealed that, even without a ‘carbon lens’ per-se, the initial approaches our industry has taken so far, such as using the waste hierarchy, recycling, and moving towards a circular economy, have made a significant difference. From 1990 to 2019, the sector has reduced its emissions profile by two-thirds.
Testing, testing 1,2,3
In terms of measuring progress going forward, Jamie and the other panellists refer to scope one, two and three emissions throughout the webinar. If you’ve not heard of these terms before, scope one emissions cover greenhouse gas (GHG) emissions that a company makes directly, for instance, in the waste and resource sector this could be the emissions that non-electric fleet produce. Scope two emissions are made indirectly when the energy a company purchases is produced. And finally scope three emissions, which are much broader and more difficult to measure and control, are not produced by the company itself, nor the activities or assets owned or controlled by them. It’s those that the company are indirectly responsible for up and down its value chain. Some examples in our sector could be the emissions produced when PPE for employees is made and transported by a third party; business travel or employee commuting to offices and sites; and the outbound logistics associated with selling products such as refuse derived fuel (RDF) in any vehicles that are not owned by the company, as well as the burden of the actual treatment of the RDF in a third party facility.
Avoided benefits were also discussed, and these related to the benefits third parties get from using some of the products we in our sector produce, like when a manufacturing company uses steel recycled by SUEZ. Much of the hard work done by the waste and resource sector is to generate products from waste that help others avoid the burden of using virgin resources.
What’s more, emissions can be categorised even further into upstream and downstream emissions. Upstream emissions occur during the production of goods or services that a business purchases or uses. So, in my above examples, this applies to PPE being produced for employees. Downstream emissions result from the use or disposal of a business’ products or services. Again, looking at the above examples, this applies to the onward transportation of RDF – and beyond that, the use of it by other companies.
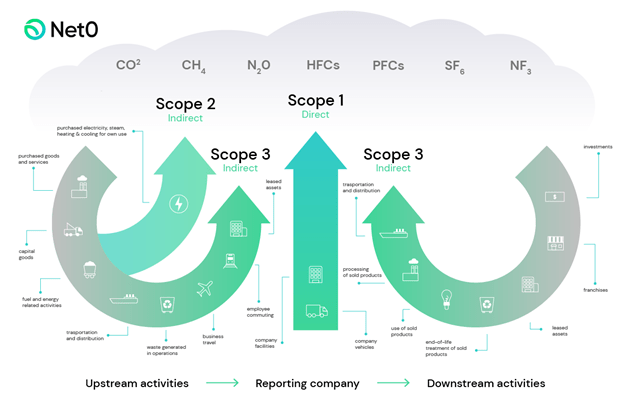
Graphic source: net0.com
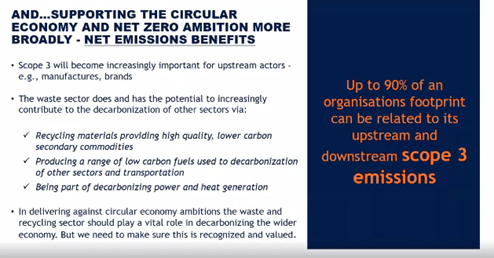
The point in all of this is that a lot of the waste and resources sector are measuring and acting to reduce scope one and two emissions, but scope three and the avoided benefits are far more complex to measure and therefore are more difficult to minimise or maximise. Despite its complexity, this is a critical area that needs progress in the future. As Jamie said during the webinar, up to 90% of an organisation’s footprint can be related to its upstream and downstream scope three emissions.
Hopefully this explanation shows you how closely linked everything is, within the waste sector, and between the waste sector and the wider economy. You’ll notice that ‘waste’ and ‘disposal’ are words that pop up within scope three emissions a lot. So, our sector naturally plays a key role in the emissions produced by the rest of the economy across all sectors.
The waste and resources sector can help to reduce scope three emissions in other areas of the economy, such as by diverting waste away from landfill, recycling, and facilitating reuse and repair. As we get closer to a circular economy, this will further improve. But we’re still on that journey, and our sector needs better data on scope three and avoided emissions to help us take further action.
How carbon is integrated into policy
The second panellist, Keith James from The Waste and Resources Action Programme (WRAP), a climate action non-governmental organisation, looked at how carbon is integrated into policy.
WRAP have previously worked with different government departments to look at the emissions of material in landfill over their whole life. This revealed that around 10 million tonnes carbon dioxide equivalent (TeqCO2) of GHG emissions were produced per approximately 50 million tonnes of waste. When looking at different waste management routes, WRAP uncovered the huge benefit that accrues to other company’s carbon accounts through recycling. Recycling helps industry avoid around 60-70 million TeqCO2 of GHG emissions per year. So, when you look at the bigger picture, it’s a no-brainer. Recycling is a big win! but not as big as preventing the waste in the first place. However, these carbon savings are accrued all over the world, as the UK exports recycled material, so those benefits aren’t all realised within the UK. This is the first policy and sector challenge.
Keith went on to look at the GHG emissions associated with the production of materials wasted. This revealed a correlation of approximately one tonne of waste to one TeqCO2. So, the stuff that people are throwing away already comes at a big CO2 cost before they’re even treated or disposed of. A big chunk of the problem here is consumerism. It links back to the circular economy; it links back to reuse and repair. And that’s another challenge when it comes to policy change, a holistic approach is needed that encompasses all of the above.
WRAP started work in this area with the Scottish government in 2012. Scotland have set themselves the ambition to reduce the carbon footprint of waste management on a lifecycle basis by 20% by 2025. In England, the waste and recourses strategy in 2018 highlighted measuring waste in terms of carbon as well as weight, as did SUEZ in its own Vision document. Since then, there has been more realisation that the circular economy is key to driving net zero ambitions, and the waste sector plays a pivotal role.
A climate emergency
The next panellist, Emma Beal, from The West London Waste Authority (WLWA), talked about how six of their boroughs declared a climate emergency in 2019. She explored what WLWA are doing to act on this.
For context, Emma explained how previously, decarbonisation by removing waste from landfill was within their control and is now mostly complete. However, what they’re now facing, is the more complex issue of increasing recycling and reducing waste in general – circular economy thinking.
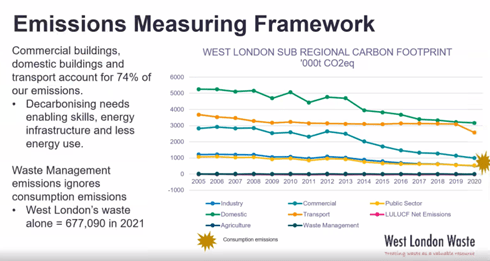
WLWA worked as part of the West London Climate Emergency Officers group to pull together plans and measure emissions. This uncovered that commercial buildings, domestic buildings, and transport account for 74% of their emissions. Waste management was sitting at the bottom, at almost 0%. However, waste management emissions in this context were ignoring consumption emissions. And when WLWA shifted the way they were looking at it and started to consider scope three emissions, it was actually quite substantial.
Where do we go from here?
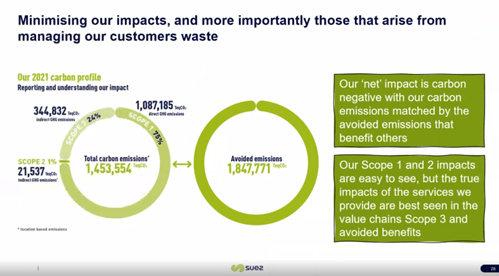
The final panellist, SUEZ’s Stuart Hayward-Higham, shared the company’s 2021 carbon profile. This revealed that our scope one emissions make up 75% of our total emissions, scope two only 1%, and scope three 24%. Our total carbon emissions were 1,453,544 TeqCO2, however our ‘net’ impact is carbon negative, as our carbon emissions are matched by avoided emissions that benefit others (1,847,771 TeqCO2 in 2021). Stuart explained that our industry spends a lot of time talking about scope one and two impacts, as they’re easy to see, but the true impact of the services we provide are best seen in scope three and avoided benefits, which are often overlooked and not fully understood.
Stuart went on to look at some of the ways we can contribute to energy security, carbon, and resource security in our sector. This includes carbon reduction from operations; carbon reduction from the products we make such as electricity, heat and recycled or repaired materials; and increasing the production of low carbon liquid fuels.
Conclusion
Society must stop producing so much waste in order to reduce the carbon that’s generated to treat or dispose of it. We’ve got to stop producing so much stuff, reduce consumption, reuse, repair and recycle. But, until we get there, the waste and resources sector has a huge part to play in the wider economy’s scope three and avoided emissions. We are helping others to avoid a lot of emissions and making a great, positive contribution, but there’s always more that can be done.
The next step is a collaborative approach across the sector, up and down the waste value chain. Let’s keep driving better measurement of scope three emissions and use the data to drive forward more change. Let’s keep carbon as one of the main drivers and rationale behind decisions being made today and in the future.
You can watch the full recording of the webinar any time here.
Tweet